Description
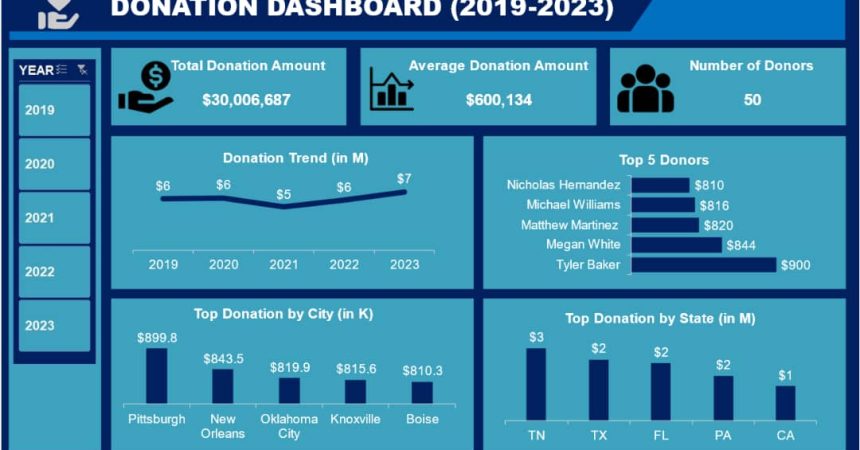
Enhance your data's value with my comprehensive Data Analysis and Visualization services in Excel and Power BI. Whether you're looking for a clear, high-level view or detailed insights, I provide customized solutions to help you make data-driven decisions. Here’s what I offer:
Core Services:
Data Preparation & Cleaning: Ensuring data accuracy and consistency by cleaning, structuring, and organizing.
Advanced Data Modeling: Creating scalable models for complex calculations and analytics.
Interactive Dashboards: Designing engaging, real-time dashboards with filters for dynamic insights.
KPI Tracking & Reporting: Setting up metrics to keep stakeholders informed with the latest data.
Automation & Efficiency: Utilizing tools like macros and Power Query for seamless data processing and reporting.
Excel-Specific Skills:
📊 Data Preparation: Cleaning data by removing duplicates, filling blanks, and adjusting format for consistency.
📈 Data Transformation: Importing, loading, and transforming data from multiple sources.
🤖 Automation: Using macros and Power Query to streamline workflows.
📊 Data Visualization: Crafting visuals such as pivot charts, scatter plots, bar charts, and dynamic dashboards.
🧮 Descriptive & Predictive Analysis: Leveraging formulas, forecasting tools, and advanced data analysis functions.
🎨 Conditional Formatting: Applying conditional formats for visual emphasis.
🔍 Advanced Filtering & Sorting: Improving data visibility and clarity with advanced sorting techniques.
Power BI Specialties:
🌐 Data Integration: Importing data from various sources and creating interactive Power BI dashboards.
🔄 Real-Time Updates: Configuring dashboards for real-time monitoring and decision-making.
📈 Custom KPIs: Creating unique performance indicators tailored to your business needs.
I’m here to help you unlock actionable insights from your data, optimizing your processes for efficiency and better decision-making.


